Recent Runs Panel – Inspecting Scenario History
The Recent Runs panel is your one‑stop audit trail for everything that has executed as a complete scenario—whether triggered manually or by the Orchestrator.
Runs launched from selected branches in the action tree are not captured here; only full‑scenario executions appear.
Why it matters
- Quickly verify that overnight jobs finished successfully.
- Pin‑point the exact action, log line or screen where a failure occurred.
- Compare multiple runs side‑by‑side without re‑opening projects.
Opening the panel
Click the clock icon on the left sidebar.
A list of past runs appears on the left; details for the selected run fill the right‑hand area.
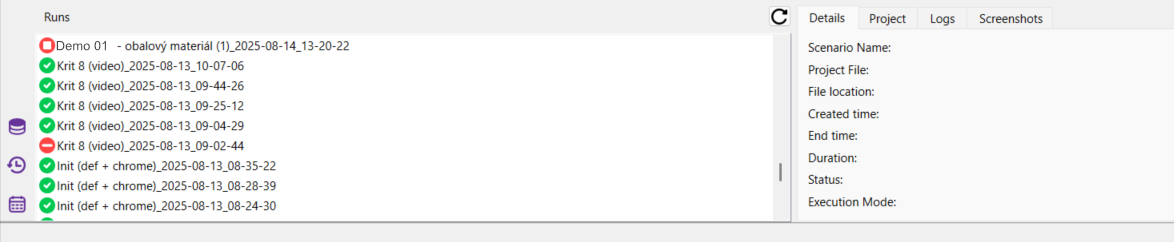
Run list
Each entry shows its status:
| Status | Meaning |
|---|---|
| Succeeded | Scenario finished without errors. |
| Failed | One or more actions ended with error. |
| Cancelled | Execution was intentionally stopped before completion. |
Tip: Use the refresh icon ↻ in the top‑right corner to reload the list if another instance is executing scenarios.
Tabs explained
| Tab | What you see | Typical use |
|---|---|---|
| Details | Scenario name, project file, path on disk, start/end timestamps, total duration, exit status and execution mode (Manual / Auto). | Quick health check & runtime statistics. |
| Project | Read‑only tree of all actions exactly as in the scenario editor. Each node is marked ✓ or ✗ depending on outcome. | Locate the precise step that failed. |
| Logs | Chronological text log identical to the console output. | Review warnings, errors or variable values printed during run. |
| Screenshots | Scrollable gallery capturing the UI after each action. | Visually confirm what was on screen at any point in the run. |
Combine Project + Logs + Screenshots to understand why a step failed:
- Find the red ✗ in Project, 2) read its corresponding message in Logs, 3) view the screenshot taken right before the error.
Investigating a failure – example workflow
- Pick the top failed run (red icon).
- In Project tab, expand nodes until you see the first red ✗.
- Switch to Logs and scroll to the matching timestamp—note any error message.
- Open Screenshots and jump to the same index; confirm what the robot saw.
- Fix the scenario (or target application), re‑run, and watch the entry turn green.